
I used to hate winter, especially the way the trees looked. The weather cold and bleak, and the trees nothing but sticks. In the spring the fruit trees are covered by beautiful blossoms. (Okay, I admit it: Hay fever can be a problem.) In the summer a grove of trees is a cascade of different shades of green, and in the fall they’re a rainbow of multiple colors. But in the winter? Nothing. Ugly. Depressing.
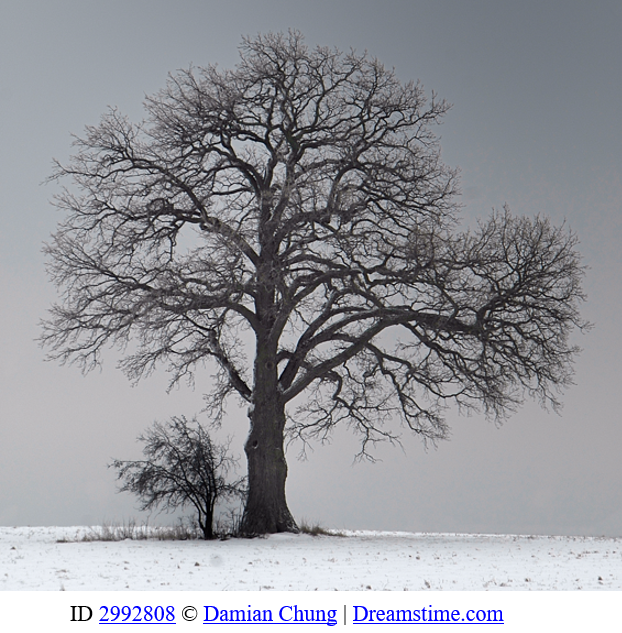
But then one day I realized that in the winter trees are mathematical graphs. Look at the image above. Now look at the upper left:

Do you see how smaller branches grow off the bigger limbs, and there are twigs off the smaller branches? This is exactly how mathematical graphs look – although perhaps a little less chaotic. Here’s an example of a mathematical graph from one of our videos, giving a simple example of the possible results of a compound random process:

It probably won’t surprise you that this graph is called a tree.
There are numerous examples of where math occurs in our daily life.
In building a house:
- How much soil do we excavate? How many truckloads to haul it away?
- How many yards of concrete do we pour?
- How is the plumbing laid out so there are no leaks and nothing gets stuck?
- What about the HVAC and the electrical connections?
- What is the pitch of the roof?
- Etc.
And we have similar problems to solve with cooking, sewing, planning for large events, building an auditorium to seat 1000, and so on.
Yes, Math is Truly Everywhere.
And that’s why we emphasize Real World Applications in our math instruction on this site.
Gary
Leave a Reply